How Much Power Do Solar Panels Really Produce?
If you’ve ever looked at a solar panel’s spec sheet and seen “400 watts,” then looked at your electric bill and wondered why your system doesn’t seem to hit that number, you’re not alone. This confusion is exactly why Solar Panel Power Output Explained matters more than most homeowners realize. The gap between a panel’s lab rating and what it actually delivers on your roof can be 20 to 30 percent, and that difference directly affects whether your investment pays off.
Manufacturers test panels under Standard Test Conditions (STC), a lab setup that uses 25°C cell temperature, 1,000 watts per square meter of sunlight, and a specific air mass. Your roof doesn’t match those conditions. So let’s walk through what real-world output looks like, why it varies, and how to get an honest estimate before you sign anything.

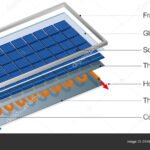
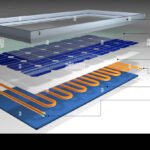
Image source: Wikimedia Commons / Calderoliver (CC BY-SA)
Quick Answer
A standard residential solar panel produces between 250 and 450 watts of DC power under ideal lab conditions. In real-world use, expect 75 to 85 percent of that rating. That means a 400-watt panel typically delivers 300 to 340 watts on a sunny day.
Annual energy production depends on your location’s peak sun hours and local weather patterns. Always size your system based on realistic output, not the nameplate number.
Why Accuracy Matters When Talking Solar Output
Getting the output number wrong can cost you thousands. If you oversize based on optimistic ratings, you pay for panels you don’t need. If you undersize, you still have a utility bill and lose the energy independence you wanted.
There’s also a safety angle. Every component in your system, inverter, wiring, breaker, gets sized around expected current and voltage. Overestimate the output, and you might underspec the inverter, leading to clipping or overheating.
Underestimate, and you could overspend on components that never get fully loaded.
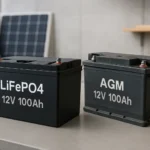
The stakes are higher for off-grid setups. If your solar array doesn’t produce enough to charge your battery bank, you’re left running a generator more often than you planned. That kills the whole point of going solar.
So accuracy isn’t just a nice-to-have. It protects your budget, your equipment, and your return on investment. When you know the real numbers, you make smarter decisions about panel count, inverter size, and even racking orientation.
How Solar Panel Power Output Really Works
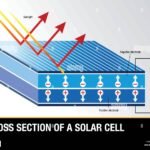
Solar panels generate electricity through the photovoltaic effect. When sunlight hits the silicon cells, it knocks electrons loose, creating a direct current (DC). The amount of current depends on how much light hits the panel and the cell’s efficiency.
The rated power output, say, 400 watts, is measured at the panel’s maximum power point under STC. That’s a snapshot of best-case performance. In practice, three main factors drag that number down:
- Cell temperature, As a panel heats up, its voltage drops. For every degree Celsius above 25°C, output falls by roughly 0.3 to 0.5 percent. On a hot summer roof, cell temps can hit 65°C, slashing output by 12 to 20 percent.
- Sunlight intensity, Clouds, haze, and even high altitude affect irradiance. 1,000 W/m² is a clear summer day at noon. Most days deliver less.
- Angle and orientation, Panels facing south at a tilt equal to your latitude capture the most sun. Off-axis panels lose 10 to 25 percent depending on the season.
Here’s a quick overview of how these factors stack up in a typical home installation:
| Factor | Typical Effect on Output |
|---|---|
| STC rating (nameplate) | 400 W DC |
| Temperature derating (hot day) | –15% to –20% |
| Soiling (dust, pollen, snow) | –2% to –5% |
| Wiring and inverter losses | –5% to –10% |
| Real-world AC output | 270 to 340 W (for a 400 W panel) |
Per manufacturer specifications, most panels come with a positive power tolerance of 0 to +5 watts, meaning actual nameplate output is slightly above the label. But that’s still under lab conditions, not your roof. The table above gives you a more honest range.
What Affects Your Real-World Output: Temperature, Sunlight, and Shading
Three environmental factors dominate real-world output, and each one demands a different response.
Temperature. Panels work better in cold weather. That might sound backwards, but it’s true. A 400-watt panel on a 75°F (24°C) day might put out 380 watts.
On a 95°F (35°C) day, that same panel could drop to 340 watts. The heat causes voltage loss. This is why hot desert climates actually see lower per-panel output than cooler coastal areas, even with more sun.
Sunlight intensity. Peak sun hours (PSH) measure how many hours per day sunlight averages 1,000 W/m². The US sun belt gets 5 to 6 PSH daily. The Pacific Northwest might get 3 to 4.
Your annual production scales almost linearly with PSH. If you live in Seattle, expect about 60 percent of the output someone in Phoenix gets from the same panels.
Shading. Even partial shade on one panel can cripple the whole string. Most residential systems use string inverters, which connect panels in series. A shaded panel forces the whole string down to its reduced current.
That’s where microinverters or power optimizers help, because they isolate each panel’s performance. For a south-facing roof with no nearby trees, shading may not be an issue. For a roof with chimneys, vents, or morning shade, it’s the biggest threat to output.
If you’re evaluating a site, check for shade between 9 a.m. and 3 p.m. year round. That four hour window produces roughly 80 percent of your daily energy. A few hours of shade there can cut your annual output by 20 to 30 percent.
System designers use tools like NREL’s PVWatts calculator to model these factors. It’s free and gives a surprisingly accurate estimate based on your address, roof pitch, and local weather data.
How to Estimate Your System’s Daily and Yearly Energy Production
You don’t need a degree in electrical engineering to get a solid ballpark. Here’s a simple formula that installers use every day:
Daily energy (kWh) = Panel wattage × Peak sun hours × System efficiency × Number of panels
Let’s walk through an example. Say you have 20 panels rated at 400 watts each, in a location with 5 peak sun hours. System efficiency covers inverter losses, wiring, and soiling, typically 0.75 to 0.85.
Use 0.80 as a conservative starting point.
- Total DC capacity: 20 × 400 W = 8,000 W (8 kW)
- Rough daily AC output: 8,000 W × 5 hours × 0.80 = 32,000 Wh = 32 kWh per day
- Yearly output: 32 kWh × 365 = 11,680 kWh per year
That’s enough to cover an average US household’s annual usage of about 10,600 kWh (as of 2026). But your mileage will vary based on local shading, panel tilt, and inverter efficiency.
To refine the estimate, check your utility bill for your actual monthly kWh usage. Then work backwards: divide your annual usage by 365, then by your location’s PSH, then by 0.80. The result is the DC system size you need.
Divide that by the panel wattage to get the number of panels.
Here’s a fast reference for common US regions:
| Region | Peak Sun Hours (avg) | Panels Needed for 8 kW System |
|---|---|---|
| Southwest (AZ, NM) | 5.5–6.0 | 18–20 |
| Southeast (FL, GA) | 4.5–5.0 | 20–22 |
| Midwest (IL, OH) | 4.0–4.5 | 22–25 |
| Northeast (NY, MA) | 3.5–4.0 | 25–28 |
| Pacific Northwest (WA, OR) | 3.0–3.5 | 28–32 |
[Internal link to Solar Panel Buying Guide] The numbers above assume a typical inverter setup and south-facing roof with no shade. If your roof faces east or west, add 10 to 15 percent more panels to compensate.
One more thing: these estimates assume you’re using a modern string inverter with MPPT. Older systems or poorly matched inverters can drop system efficiency to 0.70 or lower. That’s why a quality inverter is just as important as the panels themselves.

Similar Posts